Update: Climate Risk at a Tipping Point?
Air Temperature, Sea Surface Temperature, and Tropical Storms
 Schrödinger’s cat plays peek-a-boo
Air and Sea Surface Temperature (SST) records have been broken.1
Is this due to
- an extreme tail event within slowly evolving climatic change?
- a mid-tail event within gradually accelerating climatic change?
- a typical event within rapidly accelerating (tipping-point) climate change?
Around the time of this update there has been a cascade of news articles making the same point.
- Climate graphic of the week: Oceans set heat records for more than 365 days in a row
- World on ‘red alert’ after heat records smashed in 2023, UN agency says
- Why is the sea so hot?
- World in ‘unknown territory’ after heat records, says head of UN’s climate body
- Climate models can’t explain 2023’s huge heat anomaly — we could be in uncharted territory (in Nature)
According to Copernicus Climate Change Service (C3S), February 2024 was the warmest on record, bringing the total number of consecutive record-breaking globally hottest months to 9. This pushed the 12-month mean global temperature (Mar 2023 – Feb 2024) to exceed the 1850-1900 pre-industrial average by 1.56°C.
The February average global Sea Surface Temperature (SST) for 60°S–60°N reached a new absolute record level of 21.06°C. The previous high was in August 2023.
.](/post/tipping-point/sst_hu5e465abe7586c60cca7a65fd4bcd720d_1010554_aa883ec24eddb39aa42c15efc6042c1c.webp)
According to the latest ENSO update and prediction by NOAA National Weather Service, “transition from El Niño to ENSO-neutral2 is likely by April-June 2024 (79% chance), with increasing odds of La Niña developing in June-August 2024 (55% chance).”
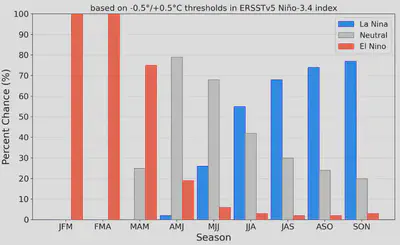
El Niño is declared when SST in the tropical eastern Pacific rise to at least 0.5°C above the long-term average, while La Niña is declared when SST in the tropical eastern Pacific falls to at least 0.5°C below the long-term average. Moreover, these thresholds must be exceeded for a period of at least 5 consecutive overlapping 3-month seasons.
During El Niño there are typically more tropical storms in the tropical Pacific, but fewer in the tropical Atlantic.
During La Niña, the opposite pattern typically holds: there are more tropical storms in the tropical Atlantic than in the tropical Pacific.
](/post/tipping-point/astorms_hua8d5edefbdf5264859a25ffeeba12a24_165035_50a0b666e26cba49634be74d46c48ac2.webp)
The annual counts of Tropical Storms and Hurricanes illustrated in Figure 3 show an increase over the post-1950 period.
However, there is substantial variability. To simplify the visual representation, consider the 10-year Trailing Averages plotted below.
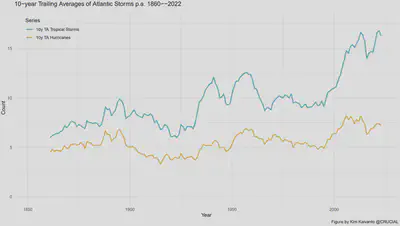
In the post-2000 period the 10-year Trailing Average of Atlantic Tropical Storms rises above and remains above previous highs.
During this period, the 10-year Trailing Average of Atlantic Hurricanes also rises above previous historical highs.
These post-2000 highs were achieved along with increased volatility in the annual count, but the volatility is comparable with the volatility of previous peaks in storm and hurricane activity.
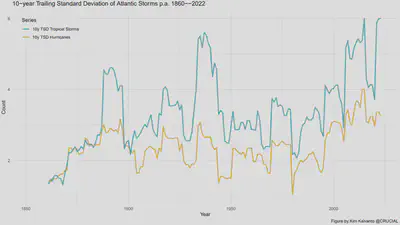
So for Atlantic Storms and Hurricanes, there is a change in mean activity without a substantial increase in volatility over previous records.
Of the three conjectures introduced at the top, this post-2000 level change doesn’t fit the archetype of #1. an extreme tail event within slowly evolving climatic change.
The post-2000 Atlantic storm data could still be consistent with either #2. a mid-tail event within gradually accelerating climatic change or #3. a typical event within rapidly accelerating (tipping-point) climate change.
Epicurus’ (c. 342–270 BCE) Principle of Multiple Explanations offers guidance here: If more than one theory is consistent with the observations, keep all of these theories.
Current data are consistent with a radical tipping-point explantion, but not exclusively so.
Like Schrödinger’s cat, we both are and are not at a tipping point in climate change.3
-
This post updates and replaces the original version dated Feb 12, 2024. ↩︎
-
“ENSO-neutral” refers to the El Niño Southern Oscillation (ENSO) being neither in the (warmer SST) “El Niño” state nor in the (cooler SST) “La Niña” state, whereby the SST in the tropical eastern Pacific falls within +/- 0.5°C of the long-term average. ↩︎
-
Gavin Schmidt, director of NASA’s Goddard Institute for Space Studies is recently quoted in The New Yorker as saying “We don’t really know what is going on. …The other thing that this could all be is, we are starting to see shifts in how the system responds… …nothing in the prior data looked like 2023. Does that mean that the prior data are no longer predictive because the system has changed? I can’t rule that out, and that would obviously be very concerning.” ↩︎