Abundance of Choice

Complex statistical analysis and mathematical modelling involve multitudes of choices and assumptions. Recent “many analysts, one data set” studies show the danger of relying solely on one research team.
Here we present several examples from this literature.
We also present an example from climate modelling in which variations in modelling choices account for a greater share of variance than variations in scenario choice.
Sognnaes et al. (2021) — emissions, integrated assessment modelling
The authors develop explicit post-2030 projections of CO2 mitigation efforts. They employ two different formulations to generate emissions-mitigation scenarios: (i) continuing rates of emissions-intensity reduction, i.e. emissions per unit of GDP, and (ii) scaling of carbon prices in proportion to per capita GDP growth.
Whereas in many studies and applications, scenario pathways are identified through ‘backcasting’ from future climate targets, Sognnaes et al. (2021) employ two formulations of near-term mitigation efforts — current policies (CPs) and nationally determined contributions (NDCs) — to which they apply the above-mentioned (i) and (ii) long-term emissions-mitigation extensions beyond 2030. This results in a 2x2 matrix of combinations.
They then simulate forward emissions pathways using a diverse set of seven Integrated Assessment Models (IAMs):
- The Global Change Analysis Model (GCAM)
- The TIMES Integrated Assessment Model (TIAM)
- ModUlar energy system Simulation Environment (MUSE)
- FortyTwo
- The General Equilibrium Model of International-National Interactions between Economy, Energy, and the Environment (GEMINI-E3)
- Intertemporal Computable Equilibrium System – eXtended Public Sector (ICES-XPS)
- The Energy-Environment-Economy Macro-Econometric model (E3ME)
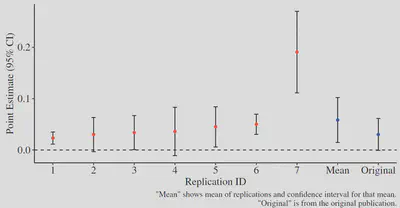
The results of these simulations are summarised in the following two figures.
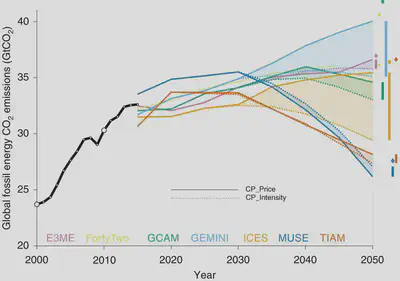
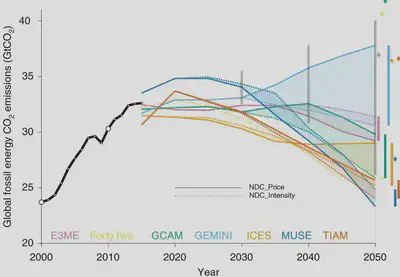
The authors’ conclusions parallel those of the ‘many analysts, one dataset’ studies:
… the model used has a larger impact on results than the method used to extend mitigation effort forward, which in turn has a larger impact on results than whether CPs or NDCs are assumed in 2030. The answer to where emissions are headed … might therefore depend more on the choice of models used and the post-2030 assumptions than on the 2030 target assumed. This renders estimates of temperature consequences of NDCs and CPs sensitive to study design and highlights the importance of using a diversity of models and extension methods to capture this uncertainty.
Menkveld et al. (2024) — finance
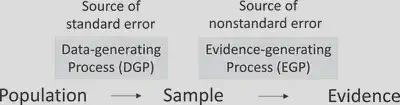
The authors study the Non-Standard Errors (NSEs) resulting from researchers picking different pathways through the myriad of data-cleaning, data-processing, and data-analysis decisions that are involved in implementing any one statistical analysis. They call this source of variation the Evidence-Generating Process (EGP), and characterise it as `erratic’ rather than erroneous, in the sense that there is not one objectively correct pathway through the data-cleaning, data-processing, and data-analysis decisions.
The authors shared 17 years of proprietary EuroStoxx 50 index futures data from Deutsche Börse with participants in the FINance Crowd Analysis Project, which included 164 research teams (RTs) and 34 peer evaluators (PEs). The research teams were asked to test 6 predefined research hypotheses ($H_0:$ no change).
| Hyp #: | Annual trend being tested |
|---|---|
| RT-H1: | market efficiency |
| RT-H2: | realized bid-ask spread |
| RT-H3: | share of client volume in total volume |
| RT-H4: | realized bid-ask spread on client orders |
| RT-H5: | share of market orders in all client orders |
| RT-H6: | gross trading revenue of clients |
The project’s preregistered hypotheses pertain to the dispersion in estimates across RTs.
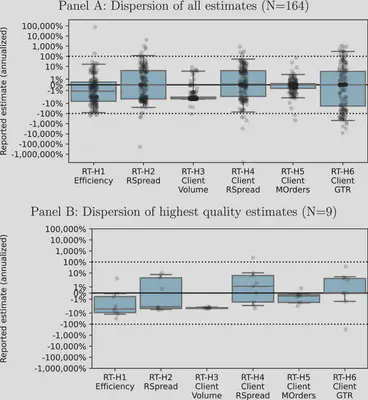
The null of no dispersion in RFE is rejected for all RT hypotheses at the 0.5% (family) significance level. The conservative Bonferroni adjustment in Panel A yields at least 11 estimates that are individually significantly different from the median (RT-H6), and at most 38 significant differences (RT-H3). There are significant estimates both above and below the median for all RT hypotheses.
We find NSEs to be substantial, even for a relatively straightforward market-share hypothesis. For this RT hypothesis, we find NSE to be 1.2% around a median of −3.3%. A more opaque RT hypothesis on market efficiency yields larger variation with an NSE of 6.7% around a median of 1.1%. We further find that NSEs are smaller for more reproducible and higher quality papers as rated by peers.
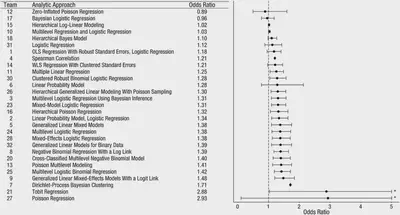
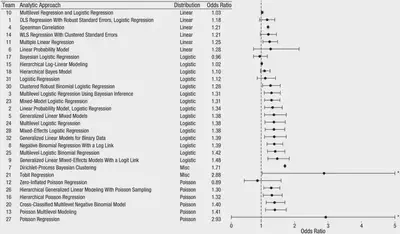
Silberzahn et al. (2018) — social science, psychology
Twenty-nine teams involving 61 analysts used the same data set to address the same research question: whether soccer referees are more likely to give red cards to dark-skin-toned players than to light-skin-toned players. …Twenty teams (69%) found a statistically significant positive effect, and 9 teams (31%) did not observe a significant relationship. Overall, the 29 different analyses used 21 unique combinations of covariates. …significant variation in the results of analyses of complex data may be difficult to avoid, even by experts with honest intentions.
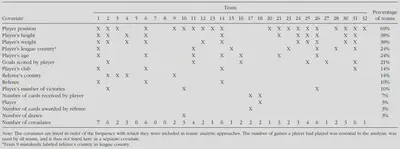
The observed results from analyzing a complex data set can be highly contingent on justifiable, but subjective, analytic decisions. Uncertainty in interpreting research results is therefore not just a function of statistical power or the use of questionable research practices; it is also a function of the many reasonable decisions that researchers must make in order to conduct the research.
Huntington-Klein et al. (2021) — economics
These researchers ask whether two published empirical studies reporting causal empirical results replicate when this is attempted by multiple research teams.
- Black et al. (2008) Staying in the classroom and out of the maternity ward? The effect of compulsory schooling laws on teenage births. The Economic Journal, 118(530): 1025–1054. Link
- Fairlie et al. (2011) Is employer-based health insurance a barrier to entrepreneurship? Journal of Health Economics, 30(1): 146–162. Link
They recruit 49 published researchers to participate in replication teams.
After attrition (due to a short completion window), they obtained 7 independent replications of each study.
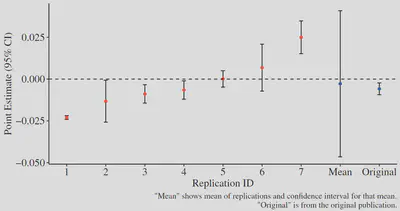
Researchers make hundreds of decisions about data collection, preparation, and analysis in their research. …We find large differences in data preparation and analysis decisions, many of which would not likely be reported in a publication. No two replicators reported the same sample size. Statistical significance varied across replications, and for one of the studies the effect’s sign varied as well. The standard deviation of estimates across replications was 3–4 times the mean reported standard error.
Breznau et al. (2022) — economics, statistics
These authors pose the question: does immigration reduce support for social policies among the public?
To answer it, they recruited 162 participants across 73 teams.
Each team was provided with a database of answers to a 6-question module on the role of government in providing different social services, which is part of the long-running International Social Survey Programme (ISSP). They were also provided with a wide range of World Bank, OECD, and immigration data.
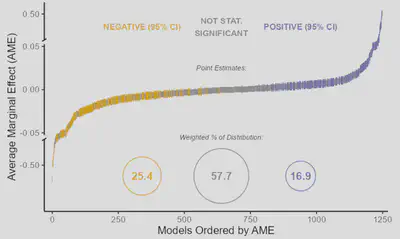
…major research steps explain at most 2.6% of total variance in effect sizes and 10% of the deviance in subjective conclusions. Expertise, prior beliefs and attitudes explain even less. Each generated model was unique, which points to a vast universe of research design variability normally hidden from view in the presentation, consumption, and perhaps even creation of scientific results.
Synopsis
These studies have explicit selection criteria to ensure that they recruit only competent researchers.
Prior to studies of this nature, the “degrees of freedom” inherent in empirical analysis were not fully appreciated by researchers.
More than abundance of choice, these studies reveal a vast universe of previously underappreciated Evidence-Generating Process variability rooted in different but ostensibly valid research design, analysis, and operationalisation choices.
Kim Kaivanto
Director of CRUCIAL
economics and finance, normative and behavioural, academic and applied